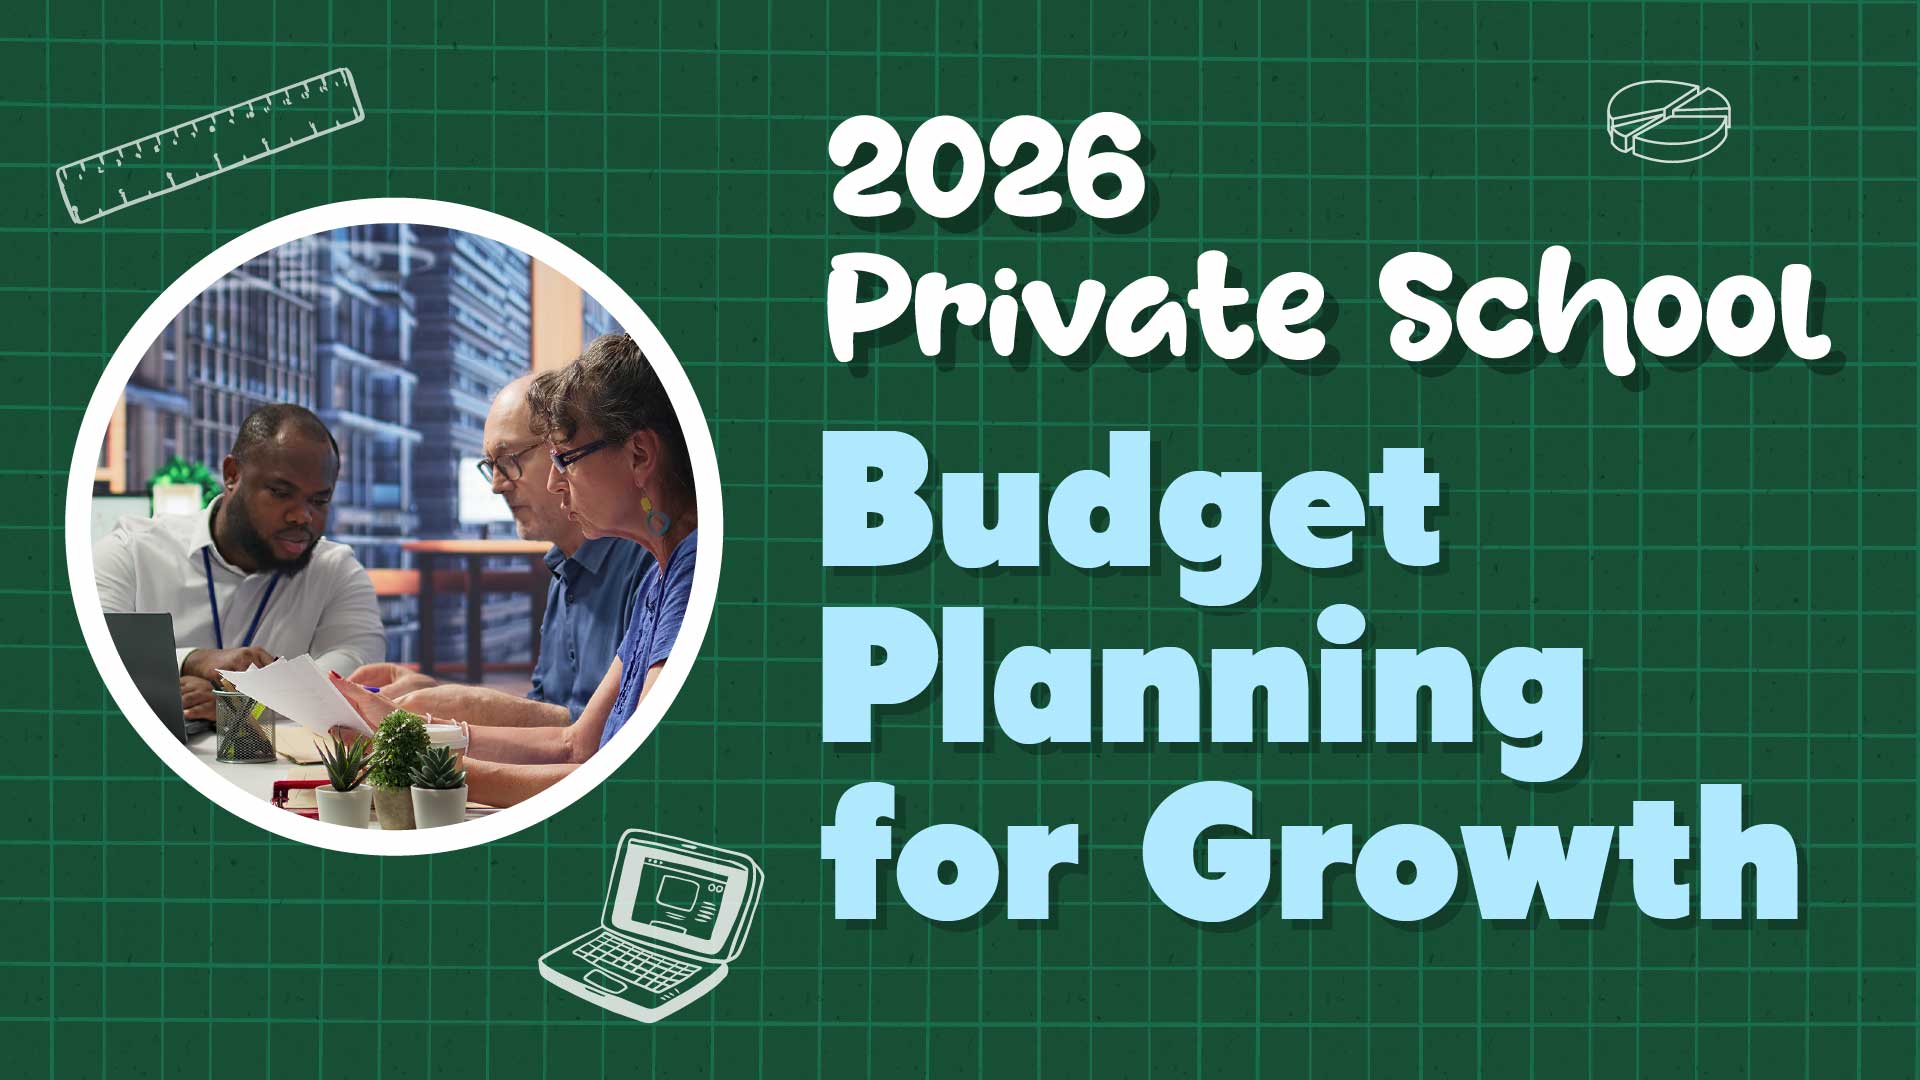
Budget season lands the same way every year. Your Head of School asks for next year's marketing budget, the deadline is a few weeks out, and the board votes on it months after that. You've got to defend every dollar, and prove ROI on money that won't be spent for 8+ months.
Welcome to budget season, where marketing directors moonlight as forecasters, rival watchers, and storytellers all at once.
Here's what makes this budget cycle different from the ones you remember: the demographic cliff is no longer a distant threat; it's here. According to the National Center for Education Statistics (NCES), total K-12 enrollment is set to drop by 2.7 million students by the 2031-2032 school year. The pain won't be spread evenly, and the Northeast and Midwest will feel it worst. States like California, New York, and New Mexico are set to lose more than 10 percent of their students. Yet some regional schools are bucking the trend, holding steady or adding students, thanks to school choice programs that put private school within reach for more families.
This shrinking pool creates what experts call a "flight to quality." Families with the means to choose are getting pickier; they want schools that can state their value in plain terms and show better results. In that market, a strong brand and sharp marketing aren't optional; they're survival tools. Add the fact that 94% of prospective students research schools online before enrollment decisions, and your website, ad strategy, and content aren't nice-to-haves; they're the ground where enrollment is won or lost.
This guide gives you budget templates by school size, channel splits backed by industry data, ROI benchmarks you can defend to your board, and a way to pitch marketing as a "revenue driver" instead of an "expense." Because if you can't defend the spend, you won't get the money. And if you don't get the money, well, enjoy explaining falling enrollment a couple of years from now.
The Marketing Budget Formula That Works
Let's start with the question your CFO asks first: "How much should we actually be spending?"
The answer rides on two things: your school's size and your goals.
Industry Benchmarks by School Size
According to NAIS research, 54% of all independent schools have yearly marketing budgets over $70,000, and another 28% spend more than $120,000. But raw dollar amounts only tell part of the story.
The smarter approach is to set your budget as a share of total operating revenue. Industry experts say schools should allocate 2-12% of annual revenue to marketing, and the exact share depends on your growth phase:
- Maintenance mode (stable enrollment, minimal competition): 2-5%
- Growth mode (expanding programs, competitive market): 6-10%
- Aggressive growth or turnaround: 10-12%
Take a mid-sized school with $10 million in operating revenue in growth mode, and that works out to a $60,000-$100,000 yearly marketing budget. Not exactly chump change, but look at this: the median cost to enroll a single new student is $3,677. If your tuition is $20,000 a year and families stay five years on average, each new enrollment is worth $100,000 in revenue. Suddenly that marketing spend looks less like an expense and more like the bargain of the century.
But pick your stance before you pick a budget framework. A school in stable maintenance mode needs a very different spend than one pushing hard to expand or clawing back from a drop. The share you choose isn't random; it reflects your school's ambition and the market you're in.
The Dangerous Gap: What Your Competitors Are (Not) Investing
Research on school marketing budgets shows the sector spends far too little: a Niche survey of schools found that 19% have no traditional marketing budget and 31% put no money at all into digital. That data comes from higher ed, but the same pattern shows up in K-12 private schools, and it hands market share to any rival with a real budget.
Read that again. Nearly one in five schools spends nothing on marketing, and nearly one in three has zero digital marketing budget, in a market where 94% of families search online before they decide.
The market has split in two. On one side sit schools that still bet on word-of-mouth and a good name. They're wide open to the demographic and market pressure above. On the other side sit schools putting real money into visibility, brand, and digital presence.
If you're a school leader ready to commit to a data-driven budget, your rivals' thin spending is a gift. Frame your proposal not as an effort to "keep up," but as a move to cash in on their weakness. While they wonder why applications keep sliding, you'll be signing their would-be students.
The Per-Student Investment Model
A second way to run the math looks at spend per enrolled student. Industry analysis suggests schools spend between $2,000 and $5,000 per enrolled student on marketing activities. For a school with 400 students, that's a range of $80,000-$200,000.
The wide spread reflects different market pressure. Schools in packed markets, or those facing aggressive charter school competition, usually spend at the high end. Schools with waitlists or a strong name in town can hold enrollment while spending less.
Here's the uncomfortable truth most marketing directors won't say out loud: if you're well below these benchmarks, you're not being thrifty; you're being negligent. Your rivals are putting money into visibility, brand, and digital presence, and every dollar they spend that you don't is market share they take while you watch.
Special Considerations for New School Launches
If you're opening a new school, the math looks nothing like it does at an established one. According to Kalix Marketing, new schools need at least 6 months' worth of heavy marketing capital on hand for a proper launch. Going slow to save cash is a common cause of failure, because without enough visibility in that first window, you never build the enrollment momentum you need to last.
For a new school aiming at 100 students at $20,000 tuition in year one, that means setting aside $200,000-$500,000 in marketing capital for the first year. Yes, that's 10-25% of projected first-year revenue. But launching underfunded and missing the enrollment mass you need costs far more than spending hard upfront for a strong launch.
The logic is simple but often ignored: a new school with no name, no alumni network, and no word-of-mouth has to buy the visibility that older schools get for free. That front-loaded spend isn't optional; it's the price of entry. Schools that try to "bootstrap" a launch on scraps often land in a loop: low visibility means weak enrollment, weak enrollment means a tight budget, and a tight budget means even less visibility. Breaking that loop after year one is far harder than funding it right from the start.
Strategic Budget Allocation: Where to Invest for Maximum ROI
Once you've set your top-line budget, the real work begins: you've got to split it up. Here's where most schools make a mistake that sinks the whole effort.
The Digital-First Reality (But Not Digital-Only)
Let's start with what most schools get wrong: research shows private schools put about 80% of their marketing spend into paid ads. (Source: IBIS Studio)
That might sound smart until you notice that paid ads only work while you pay for them. The moment the budget stops, so do the leads. Schools that lean too hard on paid ads have hooked themselves on a channel with zero lasting value. They're renting visibility instead of building equity.
A smarter split balances short-term lead generation with long-term asset building. Here's the framework that works: put 85-90% of your ad spending into digital, but spread it across channels that build different kinds of value.
The Balanced Digital Allocation Model:
SEO and Content Marketing (40-50% of digital budget): According to Ibis Studio, SEO leads are often 40-60% cheaper than paid ad leads, as low as $25-$40 per lead once your rankings hold steady. Over 12 months, SEO usually brings in 2-3 times more leads per dollar than paid ads. This is your base, the one asset that keeps working when you're not spending.
Paid Advertising (20-25% of digital budget): Use Google Ads and Meta (Facebook/Instagram) for seasonal pushes around application deadlines and open houses. The average cost per lead for Google Ads in education is $80-$150, and Meta ads usually run $60-$120 per lead. At those prices, paid ads work best for short, high-intent pushes, not year-round brand awareness.
Social Media and Email Marketing (15-20% of digital budget): Email marketing brings back an estimated 42:1 return on investment, and 82% of parents prefer email from their school. Social media does a different job that matters just as much: schools with an active social presence see 23% higher enrollment inquiry rates. (Source: Amra And Elma LLC )
The Tiered Campaign Strategy for Maximum Paid Advertising Efficiency
When you run paid ads, skip the rookie mistake of blasting one campaign at a broad audience. Build your campaigns in three tiers:
Awareness Tier (20-30% of paid budget): Broad reach campaigns built on lookalike audiences drawn from your current parents. Goal: brand visibility with families who match your ideal profile but haven't heard of you yet.
Consideration Tier (50% of paid budget): Retargeting aimed at recent website visitors. These families have shown interest, so nurture them with program highlights, student stories, and clear value messaging. This tier gets the best conversion rates because you're spending on warm leads, not cold ones.
Conversion Tier (20% of paid budget): Tight campaigns aimed at engaged families, such as email subscribers, repeat website visitors, and open house registrants, with a direct ask like an application deadline reminder or an invite to an admitted student event.
That structure keeps you from paying top rates for cold audiences while maximizing conversion rates from warm leads. Most schools run Awareness campaigns and nothing else, which explains the sad ROI they get from paid ads.
Don't Abandon Traditional Marketing (Yet)
Here's where the data gets fun. For all the talk of digital, NAIS research found in-person events were by far the best traditional tactic, with 78% of students calling the campus visit a deciding factor.
Put 20-30% of your total budget into events and community work. That covers open house production, admitted student events, and a local presence. These aren't dusty old tactics; they close the leads your digital work brings in.
But here's what matters most, and it costs nothing to run: word-of-mouth referrals. Dojo Business reported, "word-of-mouth referrals contribute 25-35% of new enrollments annually. This is the most powerful marketing channel in private education, yet it receives zero budget allocation in most marketing plans."
You can't budget for word-of-mouth directly, but every dollar you put into parent satisfaction, community events, and retention feeds that channel. This is why retention marketing (more on it later) deserves its own protected budget line: it's not just about keeping students; it's about creating advocates who drive a third of your new enrollments.
Technology and Tools: The Infrastructure Investment
Here's a line item many schools underfund: the tech stack that makes everything else work. Put 10-15% of your budget into:
- CRM and enrollment management systems
- Marketing automation platforms
- Analytics and tracking tools
- Content creation and design software
This feels like overhead until you learn that the typical independent school has three or fewer full-time staff on marketing. (Source: EAB) Tech multiplies a small team's reach. Without it, you're trying to manually manage hundreds of inquiries while you also write content, run ads, and plan events. It doesn't work.
The Build vs. Buy Decision: Understanding Personnel Costs
Before you sign up for tools, look at the full cost of doing the work. If you plan to build a whole in-house team, price in these market-rate salaries:
- Director of Marketing: $104,451
- SEO Strategist: $73,409
- CRM Manager: $93,934
- Content Creator/Social Media Manager: $50,000-$70,000
A full team runs $350,000+ in yearly salary alone, before benefits or tools. For many schools, that math makes partnering with a specialized marketing agency the better path, and so does building a lean in-house team backed by contractors.
Your 10-15% tech line should also reflect whether you're backing an in-house team or an agency. Agencies usually bundle tool access with know-how, which can cut the need for separate subscriptions and give you deeper guidance than a small in-house team can build on its own.
The Metrics That Justify Your Budget
Your Head of School and board don't care about impressions, reach, or engagement rates. They care about enrollments and revenue. Here's how to tie your marketing spend to the results they value.
Cost Per Enrollment: Your North Star Metric
The 2022 Independent School Cost-Per-Enrollment Study found the median cost per enrollment (CPE) was $3,677. Elementary schools came in lower at $2,869, and secondary schools ran higher at $5,844.
Work out your school's CPE with this formula: Total Marketing Spend ÷ Number of New Enrollments.
If your CPE sits well above these benchmarks, you've got a conversion problem somewhere in your funnel. If it sits well below, you've got a great story to tell about marketing efficiency.
Channel-Specific KPIs: Benchmarks That Signal Performance
Before you look at overall ROI, effective measurement requires tracking performance at the channel level. Here are the industry benchmarks that split strong work from weak:
Website Performance:
- Inquiry Form Conversion Rate: 2.5% is average; 3.2%+ indicates compelling messaging and a smooth user experience
- Virtual Tour Registration Rate: Target 1.8% of visitors
- Open House Registration Rate: Target 2.1% of visitors
- Bounce Rate: 30% or lower indicates engaging content; 70%+ signals content relevance or site experience problems
Email Marketing Performance:
- Open Rate: 20%+ is the education sector benchmark
- Click-Through Rate: 5%+ indicates content resonates with your audience
- Combined with the 42:1 ROI, these metrics demonstrate whether your nurture campaigns are moving families through the decision journey.
Social Media Engagement: Track engagement rate each month with this formula: (Likes + Comments + Shares) ÷ Total Followers × 100. It shows which posts spark real community talk and which get a passive scroll-by. Schools with active, engaged social communities see 23% higher enrollment inquiry rates than those with big but quiet followings.
These channel metrics work as early warning systems. When website conversion rates drop, application numbers follow 2-3 months later. Watch them and you can fix things early instead of managing a crisis late.
Marketing ROI: The Ultimate Defense
NAIS revealed, "The median ROI was $7 in tuition for each dollar spent to enroll a new student in their first year." Larger schools (700+ students) did even better at $8.60 per dollar spent.
Let's make this real. Spend $75,000 on marketing, enroll 20 new students at $20,000 tuition each, and you've brought in $400,000 in first-year revenue. That's a 533% return on investment, or a 5.3:1 ROI in benchmark language.
Now add student lifetime value. Inspired School Marketers reported, "The average retention rate for independent schools is around 90%." If students stay five years, those 20 new enrollments mean $2 million in total tuition over their time at your school. Your $75,000 spend just made $2 million. Try finding another department that can say that.
The Enrollment Funnel: Where to Focus Improvement Efforts
The average yield from application to enrollment for NAIS schools is 71.4%. But the real insight comes from tracking conversion at each stage:
Inquiry to Application: Strong schools turn inquiries into applications at these rates, based on market position:
- Newer or Less-Established Schools: 10-20%
- Elite/Highly Selective Schools: 15-25%
- Established Independent Schools: 20-35%
Knowing where your school sits gives you context for real goals. A newer school hitting 15% shouldn't measure itself against a legacy school at 30%; focus on year-over-year gains and steady spending that builds brand strength over time.
Application to Enrollment: The industry average is 71.4%.
If your inquiry-to-application rate is below your school type's benchmark, you've got a qualification or nurture problem. If your application-to-enrollment rate is below 60%, you've got a yield problem. Each one needs a different fix and a different budget.
What's Different Now: Three Strategic Priorities
Priority 1: Retention Marketing Gets a Budget Line
Here's a stat that should change how you split your money: it takes 7 times more work and resources to enroll a new family than to keep a current one.
Yet most schools park retention in student life, not marketing. That's a costly mistake. Every family that leaves mid-year or doesn't re-enroll costs you the tuition and the $3,677 you'll spend to replace them.
The money case for retention is hard to argue with: every student you keep pays full next-year tuition and costs you nothing to sign. Retention work covers parent engagement platforms, community events, and satisfaction surveys. Its return will dwarf the ROI on acquisition, because you skip the $3,677 median cost to replace that student. Yet most marketing budgets still put zero dollars into retention, treating it as a student life job, not a core marketing one.
A healthy school holds retention above 90%, and the strongest reach 92% or higher. If you're below 90%, put 10-15% of your marketing budget into retention initiatives: parent communication platforms, community-building events, and satisfaction surveys. The return on retention spending will dwarf your acquisition ROI.
Priority 2: AI Integration for Efficiency and Personalization, With Strategic Guardrails
AI has moved fast from a sci-fi idea to a real tool. But to use it well, you need to know both what it can do and where it falls short.
AI is good at the doing: personalizing email content, tuning send times, and segmenting audiences so the message fits. It can draft blog posts, social updates, and newsletters, which cuts the time content takes. For a small team, that means you can keep a steady, polished content presence without hiring anyone.
But here's the catch many schools miss: AI is a powerful assistant for execution, not a replacement for human strategy. As one marketing consultant bluntly states, "AI as a strategist... I still have yet to see this done well". The tech can help you run a strategy faster, but it can't build one for you.
The quality of AI output depends entirely on the quality of your instructions, called "prompts." Generic prompts give you generic, thin results that need a full rewrite. Sharp prompts that supply context, audience details, and clear goals can yield strong first drafts that need only light edits.
This is why your AI budget should cover two things:
Tools and Platforms ($500-$1,000 annually): Subscriptions for AI-enhanced marketing platforms and AI writing tools, such as paid versions of ChatGPT or Claude.
Professional Development ($500-$1,500 annually): Train your marketing team on prompt engineering, the skill of asking AI the right questions the right way to get output you can use. Skip the training and your team gets generic, thin results that need a full rewrite anyway, which wipes out the time you saved.
The best way in isn't chasing the newest AI tool. Find the bottlenecks in your workflow first, then see where AI can clear them. Start with one area, maybe email personalization or a social content calendar, prove the value, then widen the scope.
Priority 3: Video Content Becomes Non-Negotiable
SRV Edge data shows video gets 12 times more shares than text and images combined, and 92% of students show interest in schools that use video in their marketing.
Put 15-20% of your creative budget into video production. That doesn't mean one pricey brand film; it means a library of video: virtual tours, student stories, day-in-the-life features, and event highlights.
The smartest approach follows the "Hero, Hub, Help" model: spend big on a few polished hero pieces, meaning the brand film built for broad awareness. Make regular hub content such as a monthly series of student spotlights to keep people watching. Then shoot cheap help content like FAQ videos and walkthroughs of the application process. Now you have video for every stage of the enrollment journey without a Hollywood budget for each piece.
How to Present This Budget for Approval
You've done the research, built a data-driven budget, and split it well, so now comes the hard part: getting it approved.
Lead With Competition, Not Features
School leaders move fastest when they hear about competitive disadvantages relative to peer institutions, so open your pitch with rival intel. What are peer schools funding? What visibility do they have that you don't? Where are you losing inquiries to a better-funded rival?
This immediately reframes the conversation from "Why do we need to spend this much?" to "Can we afford not to?"
Address What Boards Don't Talk About (But Should)
Research on school board budget deliberations shows a troubling pattern: boards dig into line-item costs but rarely look at student outcomes, how last year's budget performed, or cost against value, and your pitch has to fill those gaps.
Structure your pitch to answer three questions boards usually skip:
1. Student Outcomes Connection: How will this spend improve student quality and outcomes? Tie more applications to more selectivity. Tie a better yield rate to a stronger name, which draws more committed families. Show how a broader applicant pool makes the classroom better.
2. Prior Budget Effectiveness: Show a 2-3 year trend. Chart CPE over time, conversion rates by channel, and which moves paid off best. That proves rigor, and it proves you learn.
3. Value Delivered vs. Cost: Frame every big expense as value made, not money spent: a $25,000 paid ad campaign isn't a cost; it should bring 200 inquiries, which lead to 15 enrollments worth $300,000 in first-year tuition and $1.5M in lifetime value.
Fill the gaps that usually dog board budget talks and you make marketing the most data-driven, accountable department in the room.
Translate Marketing Metrics Into Strategic Outcomes
Board members and school leaders don't speak in click-through rates and bounce rates; they speak in mission, student outcomes, and reputation. Your budget pitch has to bridge that gap by turning your metrics into their language:
Reframe Your KPIs:
- "Website Visits" becomes "Community Interest in School Programs"
- "Time on Page" becomes "Engagement with School Mission and Values"
- "Resource Downloads" becomes "Families Actively Researching Educational Options"
- "Inquiry Form Submissions" becomes "Qualified Prospects Seeking Information"
- "Event Registrations" becomes "Families Investing Time in Learning About Our Community"
Connect to Strategic Plan Goals: Pick the 3-4 key priorities in your school's strategic plan and map how marketing spending backs each one:
- Strategic Priority: Academic Excellence → Marketing investments in SEO and content allow us to highlight our innovative curriculum and faculty expertise, attracting families who prioritize rigorous academics.
- Strategic Priority: Diversity and Inclusion → Targeted digital advertising in underrepresented communities and multilingual content creation expand our reach to diverse family demographics.
- Strategic Priority: Financial Sustainability → Improved conversion rates and lower cost-per-enrollment deliver more tuition revenue per marketing dollar, strengthening the school's financial position.
That alignment shows marketing isn't a silo, but a partner in the school's core mission.
Connect Every Dollar to Revenue
Don't present line items, present revenue drivers. Instead of "$25,000 for Google Ads," say "$25,000 to generate 200 high-intent inquiries projected to yield 15 enrollments worth $300,000 in first-year tuition."
Use the student lifetime value math often: if your tuition is $25,000 a year and the average student stays six years at 90% retention, each new student is worth about $150,000 in total revenue. When $3,677 in marketing buys a $150,000 asset, the case makes itself.
Draw a funnel diagram with the stages from Awareness → Interest → Consideration → Application → Enrollment, and map your marketing work to each one, which makes marketing's impact hard to ignore, because it shows how each dollar moves families along.
Offer Tiered Options
Present your budget in three tiers:
- Must-Have: The baseline budget to maintain current performance
- Should-Have: Strategic growth investments with moderate risk and strong projected ROI
- Nice-to-Have: Innovative initiatives with higher risk but significant competitive advantage potential
That structure shows careful planning, gives leadership room to choose, and makes sure you leave with the money you must have.
Sample Budget Allocation: $100,000 Annual Marketing Budget
Here's what a smart $100,000 budget looks like for a mid-sized school:
Digital Marketing ($45,000 - 45%)
- SEO and Content Marketing: $22,500
- Paid Advertising (Google/Meta): $12,500
- Social Media and Email: $10,000
Events and Community Engagement ($25,000 - 25%)
- Open houses (3-4 annually): $15,000
- Admitted student events: $6,000
- Community presence: $4,000
Technology and Tools ($12,000 - 12%)
- CRM/enrollment management: $5,000
- Marketing automation: $3,000
- Analytics and design tools: $4,000
Creative and Content Production ($10,000 - 10%)
- Video production: $5,000
- Photography: $3,000
- Design and collateral: $2,000
Retention Marketing ($5,000 - 5%)
- Parent engagement platforms: $3,000
- Community events: $2,000
Contingency ($3,000 - 3%)
- Testing new tactics
- Unexpected opportunities
- Cost overruns
Quarterly Pacing: Don't Spend Evenly
Marketing spending should match the enrollment cycle, not calendar quarters. Guidance from Amplify says schools should line up spending with peak recruiting months.
- Q1 (July-September): 20% of budget - Planning and preparation
- Q2 (October-December): 35% of budget - Peak recruitment season
- Q3 (January-March): 30% of budget - Application and yield campaigns
- Q4 (April-June): 15% of budget - Planning and website refresh
A Note on Q1 Spending: Q1 gets the smallest share (20%), but it decides how well the bigger quarters go. Use the summer for planning, website work, content, and campaign setup, so that when families start looking in September, your school is ready to grab their attention. Skimping on Q1 planning is like trying to harvest a crop you never planted, and Q2 and Q3 will fall flat without that groundwork.
The most common mistake is spreading the budget evenly across all four quarters, which starves the high-intent fall season, right when families are looking hardest.
Conclusion
Budget season feels like a high-wire act, where you're juggling spreadsheets, rival intel, ROI math, and board politics all at once. But here's the reality: your marketing budget isn't an expense line to shrink; it's the main lever for enrollment growth and for keeping the school open.
The demographic cliff is here, competition is getting harder, and families are pickier than ever about where their tuition goes. Schools that treat marketing as a real priority backed by data, allocated intelligently, and measured rigorously will take market share. Schools that treat it as a nice-to-have will spend the next decade explaining falling enrollment to worried boards.
You've got the data now. You've got the benchmarks. You've got the framework and the ROI math. Build a budget that's defensible, sharp, and ambitious, then present it with confidence.
Because the school that buys visibility, builds digital assets, and converts inquiries best isn't just spending money; it's making sure it has students to teach next year and the years after.
Ready to make your case? Contact me and let's build a marketing strategy that turns your board into your biggest advocates.
Frequently Asked Questions
What percentage of our operating budget should go to marketing?
Industry benchmarks range from 2-12% of total operating revenue, and your growth stage decides where you land.
Strategic Budget Framework:
- Maintenance mode (stable enrollment, minimal competition): 2-5%
- Growth mode (expanding programs, competitive markets): 6-10%
- Aggressive growth or turnaround situations: 10-12%
Real-World Example: For a school with $10 million in operating revenue pursuing growth, budget $60,000-$100,000 a year. The payback is large. Each new enrollment is worth $100,000+ in lifetime value at a median acquisition cost of just $3,677.
Reality Check: Research shows 19% of schools have no traditional marketing budget, and 31% allocate zero funds to digital marketing. That hands market share to any rival with cash. The rest just wonder why applications keep falling.
How do we calculate if our marketing is actually working?
Start with Cost Per Enrollment (CPE), your most important success metric. Work it out as: Total Marketing Spend ÷ Number of New Enrollments.
Industry Benchmarks for CPE:
- Overall median: $3,677
- Elementary schools: $2,869
- Secondary schools: $5,844
Marketing ROI Math: The industry median delivers $7 in tuition for each dollar spent, which is a 700% return, or 7:1. Add student lifetime value for the full picture. If students stay five years at $20,000 annual tuition, your $3,677 acquisition cost earns $100,000 in total revenue.
Channel-Specific Performance Benchmarks:
- Website inquiry conversion rate: 2.5% average; 3.2%+ indicates strong performance
- Email marketing: 20%+ open rates, 5%+ click-through rates
- Application-to-enrollment yield: 71.4% industry average
If your metrics sit well below these benchmarks, you've got conversion problems you can name and fix by moving budget around.
Should we invest more in digital or traditional marketing?
Put 85-90% of ad spending into digital channels, because 94% of prospective families research schools online before they decide.
Strategic Digital Allocation:
- SEO and Content Marketing (40-50%): Delivers 40-60% cheaper leads than paid advertising at $25-$40 per lead once rankings stabilize
- Paid Advertising (20-25%): Google Ads average $80-$150 per lead; Meta ads run $60-$120 per lead
- Social Media and Email (15-20%): Email marketing delivers 42:1 ROI; active social presence increases inquiry rates by 23%
Don't Ditch Traditional: Put 20-30% to events and community engagement. In-person events still work, and 78% of students consider campus visit experience a deciding factor. The trick is to use digital to fill those seats.
What's the most cost-effective marketing channel for private schools?
SEO and content marketing deliver the highest long-term ROI. They bring in 2-3 times more leads per dollar than paid ads over 12 months.
SEO Advantages:
- Cost efficiency: $25-$40 per lead vs. $80-$150 for paid ads
- Compounding returns: Content assets continue working without ongoing spend
- Higher-quality leads: Organic visitors show stronger engagement and conversion rates
The Strategic Balance: Use SEO to build the base and paid ads for seasonal speed. 40-50% of the digital budget should go to SEO/content, with 20-25% to paid ads during peak recruiting months (October-March).
Timeline You Should Plan For: SEO needs 6-12 months to show results, so pair it with paid ads for quick leads during application season. Schools that lean too hard on paid ads build a pricey habit, and the moment spending stops, so do the leads.
How much should we allocate to retention versus acquisition marketing?
This is the biggest missed chance in most school budgets. It costs 7 times more to acquire a new family than to retain an existing one, yet most marketing budgets put zero dollars into retention.
Retention Budget Framework:
- Schools with 90%+ retention: Allocate 5-8% of marketing budget to retention
- Schools below 90% retention: Allocate 10-15% to retention initiatives immediately
- Target benchmark: 92%+ retention rate for healthy schools
The Money Impact: Every point of better retention saves thousands in acquisition costs. A 400-student school that moves retention from 88% to 92% keeps 16 more families and avoids $58,832 in replacement costs (16 × $3,677 median CPE).
High-ROI Retention Investments:
- Parent engagement platforms and communication tools
- Community-building events and networking opportunities
- Family satisfaction surveys with proactive intervention systems
- Alumni family re-engagement programs
Remember: students you keep pay 100% of next-year tuition and cost you nothing to sign. By the math, that makes retention the highest-ROI work you can fund.
What technology infrastructure should we budget for marketing?
Put 10-15% of your total marketing budget into technology and tools. That base multiplies your team's capacity and lets you track much more.
Essential Technology Stack:
- CRM and enrollment management systems: $3,000-$8,000 annually
- Marketing automation platforms: $2,000-$5,000 annually
- Analytics and tracking tools: $1,000-$3,000 annually
- Content creation and design software: $1,000-$2,000 annually
Build vs. Buy: A full in-house marketing team costs $350,000+ annually in salaries alone. For many schools, an agency partner or a lean in-house team backed by contractors pays back better. It also comes with tool access and know-how.
AI Budget: Set aside $1,000-$2,500 annually for AI tools and training. Focus on prompt engineering training for your team. Generic prompts give generic results, but sharp prompts can produce strong first drafts and cut writing time a lot.
How do we handle marketing budget approval and board presentations?
Lead with competitive intelligence, not feature requests. Boards move fastest on data about where they're losing, not on marketing tactics.
Presentation Structure That Works
Connect to Strategic Plan Goals: Map every marketing dollar to your school's 2-3 key priorities. Show how SEO backs your academic excellence message. Show how targeted ads advance diversity goals, and how better conversion rates shore up the finances.
Present Revenue Drivers, Not Line Items: Instead of "$25,000 for Google Ads," present "$25,000 to generate 200 high-intent inquiries projected to yield 15 enrollments worth $300,000 in first-year tuition and $1.5M in lifetime value."
Offer Tiered Options:
- Must-Have: Baseline budget to maintain current performance
- Should-Have: Strategic growth investments with proven ROI
- Nice-to-Have: Innovative initiatives for competitive advantage
Address Board Blind Spots: Bring a 2-3 year trend showing CPE over time, conversion rates by channel, and which moves paid off best. Most board budget talks skip that analysis, so fill the gap and marketing becomes the most data-driven department in the room.